
CASE STUDY
CASE STUDY
Overview
Truckstop wanted to give brokers real-time visibility into carrier fleets, but limited mapping technology and a new vendor partnership introduced complexity. I led design, UX strategy, and governance across three parallel teams (Broker engineering, Carrier engineering, and Catena) to bring the MVP to life.
| Role | Lead UX/UI Designer, Strategist, and Acting Product Manager |
| Industry | Logistics |
| Timeline | Q2-Q3 2025 |
| Tools | Figma, Figjam, MS Teams |
From compliance checks to real-time visibility
DISCOVER
Broker Problem
Brokers relied on RMIS (Registry Monitoring Insurance Services) for onboarding and compliance monitoring, but this did not provide insight into real-time fleet behavior. Without visibility into where carrier assets were located, brokers struggled to confidently cover future loads. The lack of actionable data created inefficiencies and uncertainty in load-matching.
Truckstop’s partnership with Catena, a telematics aggregator, created the opportunity to embed live ELD and vehicle data (from 75+ systems) directly into its platform, providing the technical foundation for my designs.
")
Real-time fleet location addition
Carrier Problem
Carriers had no streamlined way to consent to sharing ELD (Electronic Logging Device) data with Truckstop. Partnering with an ELD vendor introduced new possibilities, but also required designing a clear, trustworthy onboarding experience for carriers to register and authorize data sharing. This was critical for scaling adoption, as Truckstop’s Q2 KR2 goal was to enable ELD integration and onboard 500 carriers.

Redirect to connect fleet ELD
Competitive Landscape
Competitors were already moving into ELD-driven visibility, but each took a different angle. My design work positioned Truckstop to stand apart by emphasizing real-time visibility and integrated onboarding.
Competitor Snapshots
- Highway → Strong on fraud/compliance alerts, weaker on map-based visibility.
- DAT (Trucker Tools) → Expanded into GPS tracking and load optimization.
- MCP (Descartes) → Building toward full fleet intelligence with onboarding + tracking integration.
Design Implication
Truckstop’s opportunity: deliver real-time maps brokers trust + carrier onboarding that feels seamless and thus, closing gaps competitors left open.
Real-time fleet visibility features
| Features | Highway | DAT | MCP | Truckstop |
|---|---|---|---|---|
| Asset location | ✓ | ✓ | ✓ | ✓ |
| Asset status | ✓ | ✓ | ✓ | ✓ |
| State-level map | ✓ | ✓ | ✓ | |
| Geofencing | ✓ | ✓ |
User Research
To validate early design assumptions, I conducted six broker interviews alongside a short survey and card-sorting activity focused on fleet visibility needs. Each session mixed structured prompts with open discussion to surface real-world behaviors and priorities.
Research approach:
- Conducted one-on-one interviews with six brokers across different company sizes and experience levels
- Used a 20-question survey to explore how brokers interpret and apply real-time fleet data
- Ran a card-sorting activity (via Useberry) to identify which vehicle data fields brokers found most relevant for covering loads
- Encouraged unscripted feedback to capture natural workflows and expectations around map usage and data confidence
Key focus areas:
- How brokers use fleet visibility to make quick coverage decisions
- Which data points inspire trust and confidence when vetting carriers
- How much detail (and recency) is “enough” for decision-making
- What visualization styles support speed without overwhelming the user

Research Results & Insights
Through six broker interviews and a card-sorting exercise, brokers emphasized that confidence comes from clarity, not complexity. They valued fresh, reliable data and simple visuals that make quick decisions easier.
- Visibility drives trust.
Brokers said real-time visibility helps them have more confident conversations with shippers. They rely heavily on knowing “who’s nearby and available” rather than exact GPS points. - Recency matters most.
Across all interviews, brokers ranked time and date of last update as the most critical data point. They want quick confirmation that the information is fresh before they use it to cover a load. - Hours-of-service is a signal of readiness.
Most brokers viewed hours-of-service and driver status as key indicators of whether a truck can realistically take a load soon — not just if it’s in the right location. - Location context beats precision.
Brokers preferred city or regional identifiers instead of full addresses. They don’t need to know the exact street, just that the truck is in the general operating lane. - Top data priorities (from card sorting)
- Time/Date
- Hours of Service
- Location
- Driver Status
- Recent Driver Behavior (e.g., speeding, idling)
Lower-ranked: VIN, Odometer, OEM, Fuel Level — considered “nice to have” but not decision-critical.
Where constraints and challenges shaped opportunity
DEFINE
Technical Constraints
- Mapping technology limitations: The business opted not to invest in paid solutions (e.g., Google Maps, Mapbox). This restricted us to Leaflet as the mapping container and OpenStreetMap for tiles, limiting styling and detail.
- Feature trade-offs: We explored whether to display roads, cities, and routing. Research showed brokers didn’t need street-level detail—state boundaries were sufficient for lane-based visibility.
- Legacy dependencies: Some components were tied to unfinished prior projects, forcing us to inherit Leaflet and OpenStreetMap instead of starting fresh.

Choropleth Map
There were limited options for color, tied directly to CSS. Another product shared the use of the choropleth map, so I wanted to be thoughtful of how we use color.

Do we really need tiles?
While exploring the tiles, I discovered that the leaflet plugin could rely on just the choropleth layer without tiles. This would be useful for scaling into widgets in coming iterations.

Open Streets Map (free)
When zoomed in, this get’s graphically noisy, with little customization. Unfortunately this was one of the trade-offs with a free mapping service.

Simplicity, no colored states (yet)
I needed more data for the color strategy. So initially I went with a strong outline and light diagonal pattern to represent states that have active equipment.
Organizational Constraints
- No dedicated Product Manager: On the carrier side, I assumed governance responsibilities—reporting progress to directors/VPs, coordinating with the ELD vendor, and guiding strategy.
- Three parallel teams: Broker engineers, Carrier engineers, and the ELD vendor operated on separate tracks, requiring continuous alignment.
- Vendor immaturity: Catena was an early-stage partner with underdeveloped UX practices. Extra design leadership was required to elevate their workflows to Truckstop’s standards.


Designing process, maps, and governance
DEVELOP
Broker Workflow
I designed a real-time fleet map to help brokers locate available carrier assets with confidence. The MVP included:
- Overlaying fleet vehicles on a state-level map.
- Vehicle metadata: VIN, make/model, year, license plate, and timestamp.
- Search radius capability to explore availability within a region.
Collaboration with the broker engineering team ensured that limitations of Leaflet + OpenStreetMap were addressed while still delivering on core user needs.


Mid fidelity wireframe: Fleet map landing
Geofencing
In addition to the core MVP features, I also designed geofencing features to give brokers more control over when to be notified about assets. Instead of focusing on exact real-time positions, this approach emphasized proximity and availability. The goal was to help brokers quickly identify which carriers to contact for covering a load within a region of interest.

Mid fidelity wireframe: Radius geofence drawing tool
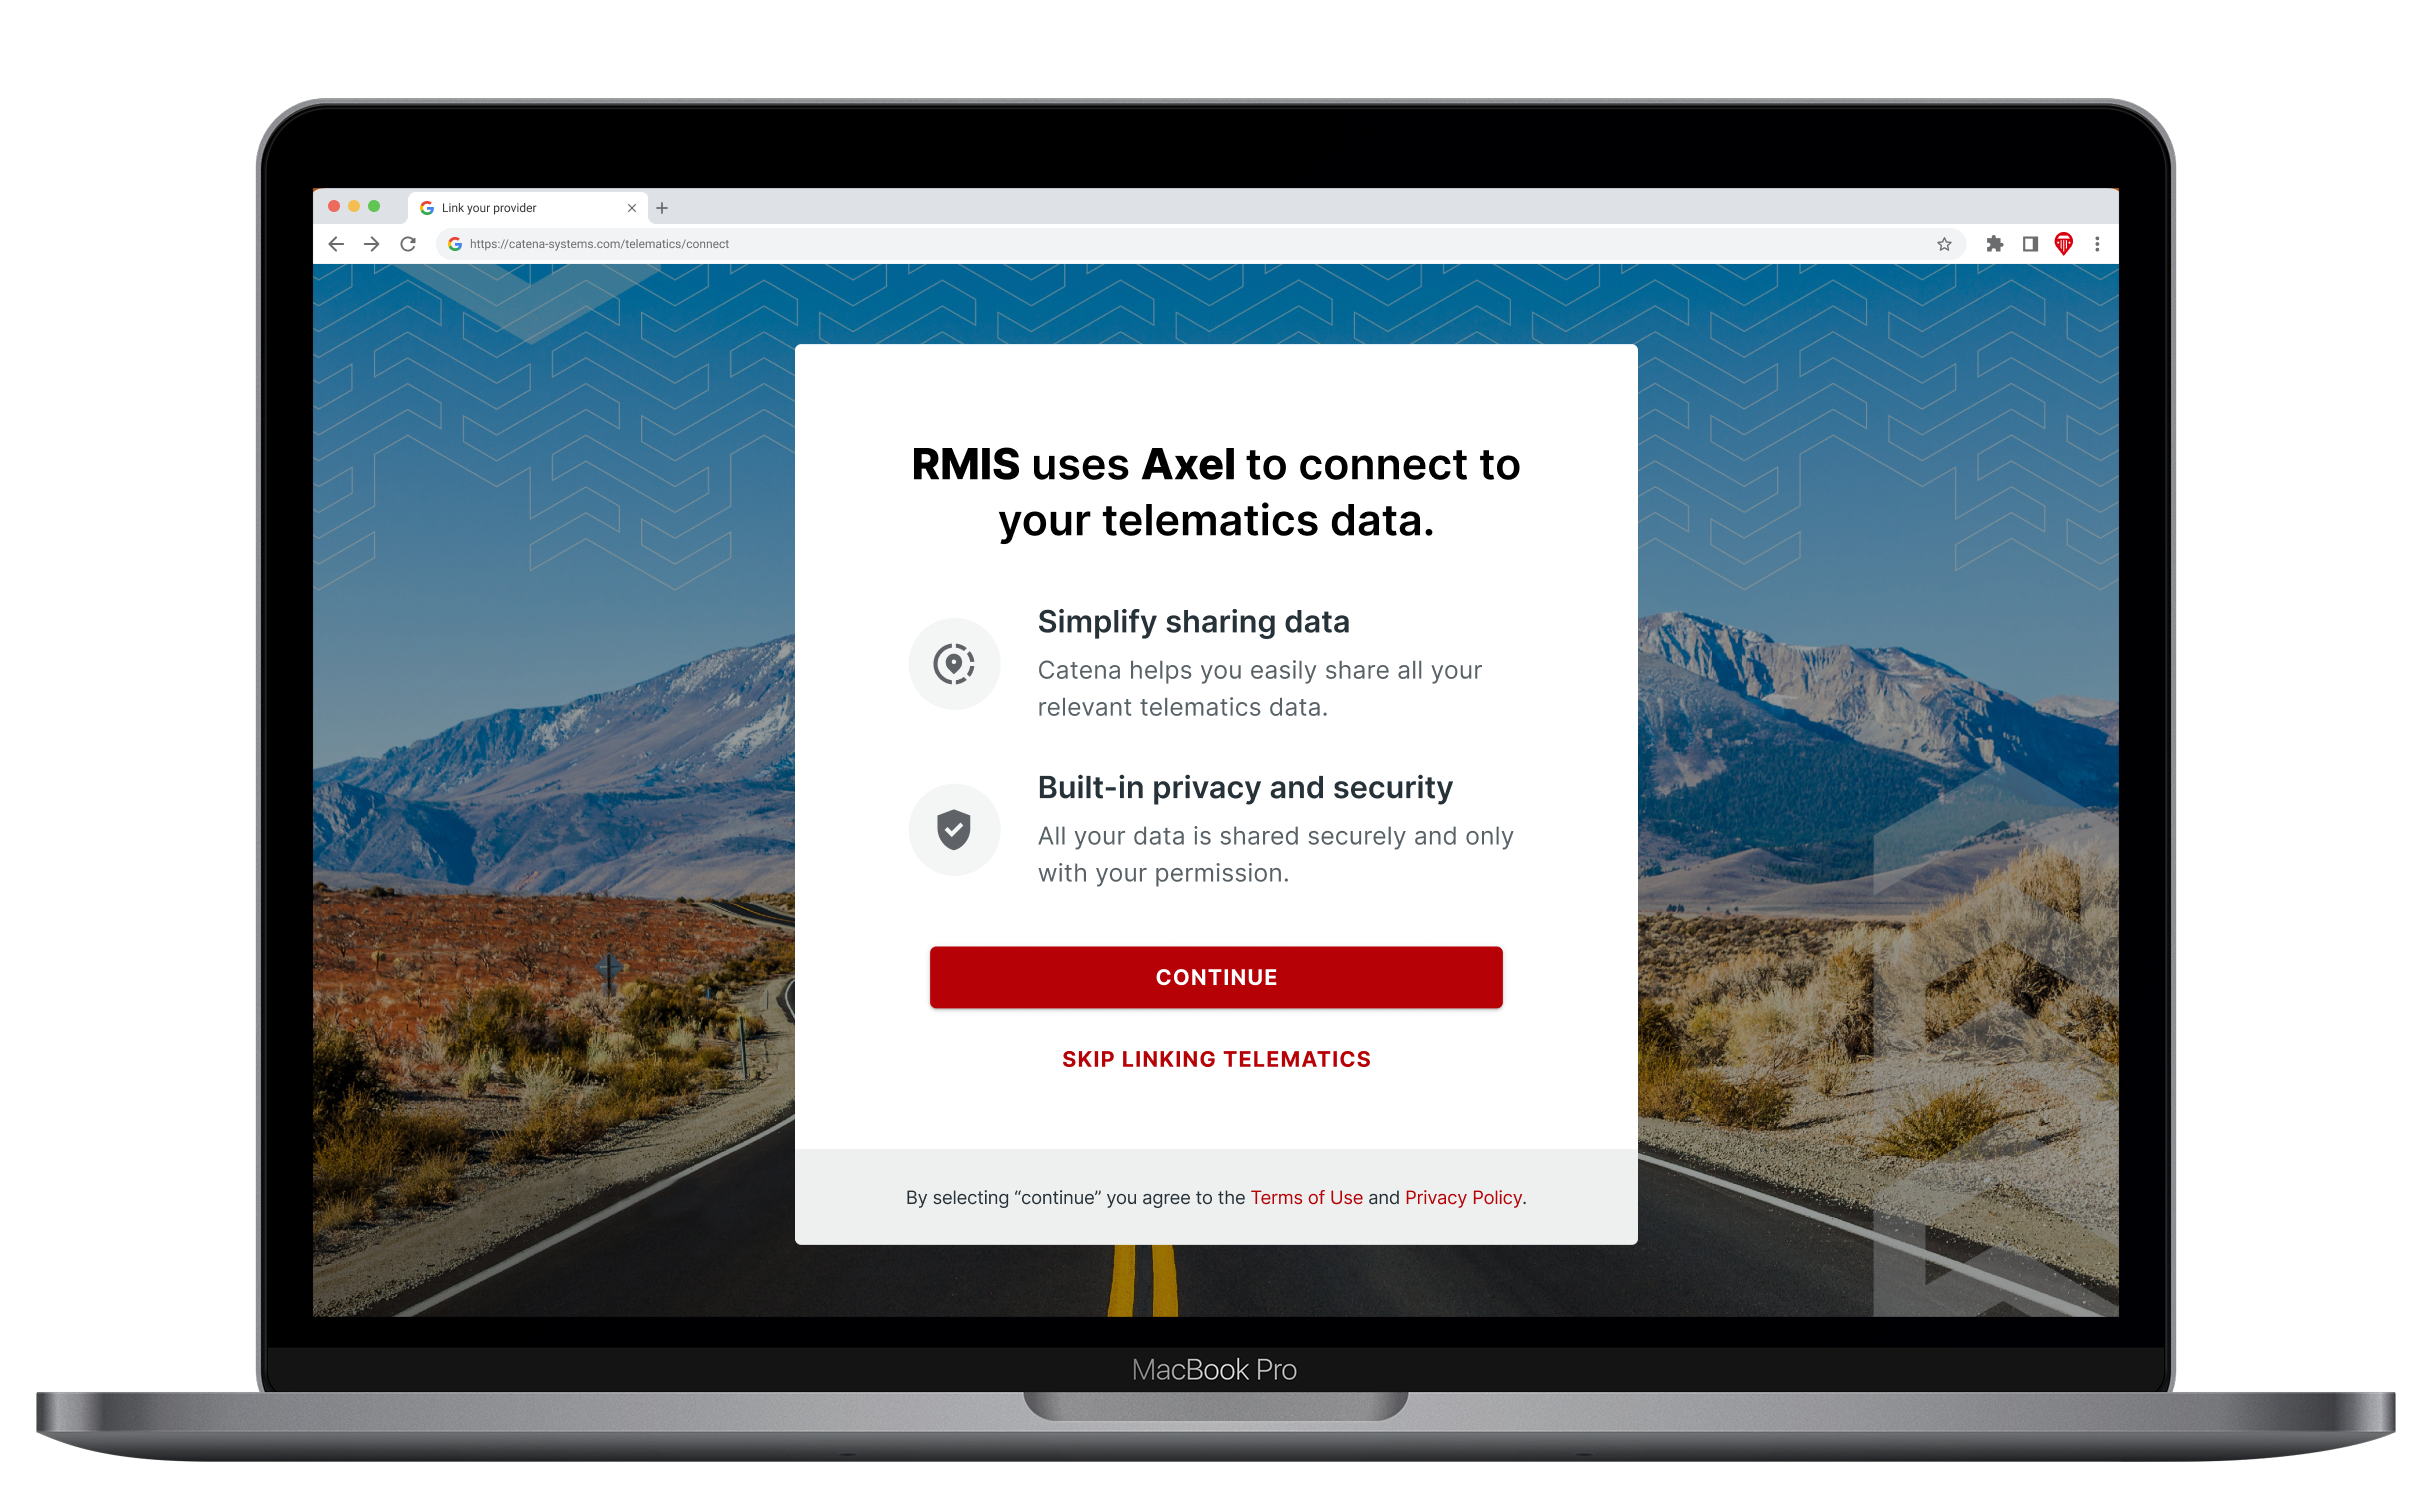
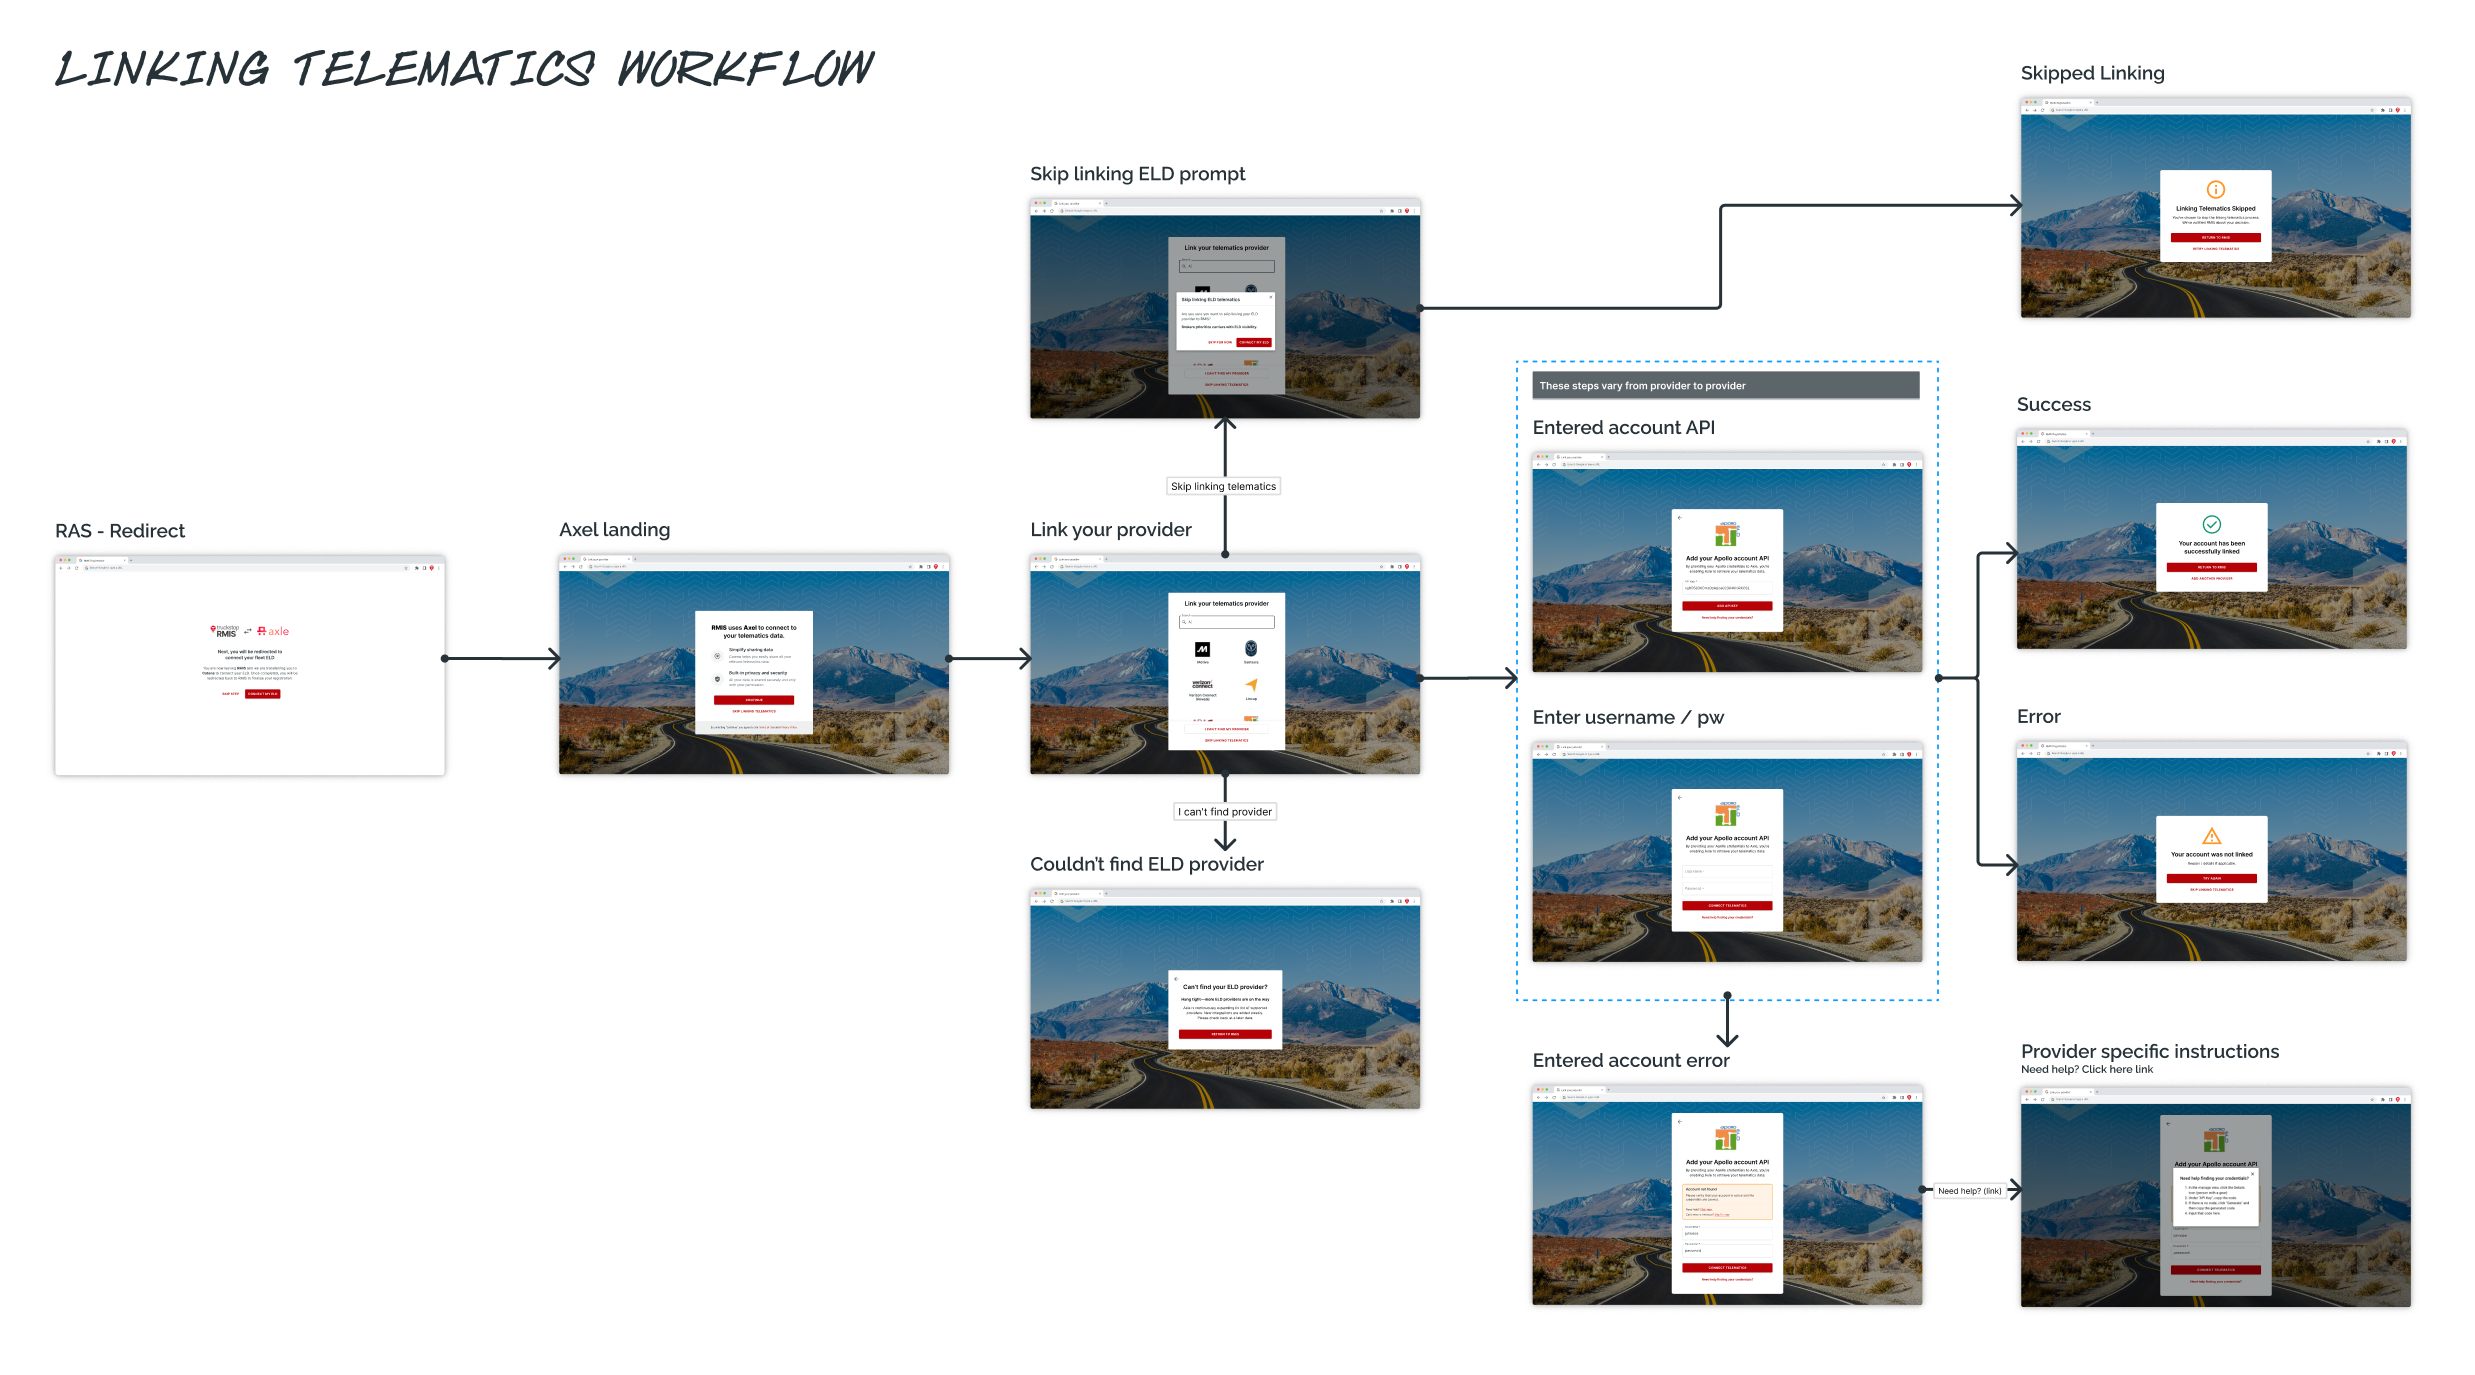
Carrier Workflow
On the carrier side, the challenge was onboarding and ELD consent. I worked directly with the vendor’s CTO and team to:
- Design an onboarding flow for carriers to connect their ELD devices.
- Provide UX strategy and high-fidelity designs for secure consent interactions.
- Create scalable workflows that allowed Truckstop to expand provider coverage in the future.
- Ensure proper branding representation on the vendor-hosted pages to maintain user trust.
- Communicate clearly that carriers were leaving the Truckstop site to add their ELD provider, and would return to continue or skip the workflow after completion.
This flow integrated into Truckstop’s RMIS onboarding process, giving carriers a seamless way to complete compliance requirements while enabling data sharing. Because Catena aggregated data across dozens of providers, we also needed to reassure carriers of branding consistency and security in this off-site flow.
Cross-Team Governance
With no dedicated product manager, I acted as the bridge across three teams::
- Provided governance updates to Truckstop directors and VPs.
- Maintained alignment between broker engineers, carrier engineers, and the vendor.
- Balanced delivery timelines with the need for scalability.
This governance role ensured the project kept momentum despite organizational gaps.

Outcomes, lessons, and what’s next
DELIVER
Broker Outcomes
- Delivered high-fidelity fleet map designs in time for a major broker conference, where representatives used them to field questions and gather broker insights on-site.
- Planned validation research with brokers to prioritize data importance (e.g., VIN, timestamp, vehicle type). While formal testing didn’t occur during the MVP phase, the survey and design framework were prepared as a future opportunity for iteration.
- Expected Outcomes: These designs laid the foundation for benefits Truckstop identified in its messaging: reduced manual check-in calls, improved load-matching efficiency, and unlocking access to premium loads by providing verified real-time visibility.
Carrier status view – map feature addition

Map landing view

Zoomed in view of New York & available assets

Radius geofence drawing tool

Polygon geofence drawing tool
Carrier Outcomes
- Produced end-to-end onboarding flow designs with Catena, ensuring brand consistency.
- Ensured transparent off-site transitions (leaving Truckstop, completing consent, returning).
- Created scalable UX patterns for future ELD provider integrations as well as mapping in general for other Truckstop products.
Carrier connecting RMIS to ELD provider

Industry Event Deliverables
- Delivered high-fidelity broker and carrier designs in time for a major industry event, where the product team leveraged them to field broker questions and gather informal insights.
- Supported Truckstop’s presence as a forward-looking partner in fleet visibility.
- While I did not attend the event directly, my work was instrumental in enabling on-site conversations with customers.

Conference showcasing Real-time Fleet Map
Reflections & Lessons Learned
Delivering this MVP required leading at the intersection of design and product strategy.
Without a product manager, I guided direction, kept alignment across three teams, and ensured progress through structure and communication.
This experience reinforced that design leadership isn’t only visual—it’s strategic.
Future Vision: Scaling Visibility
After MVP delivery, the next step was improving clarity and scalability of fleet visibility tools. The aim was to turn static data into actionable insights for brokers.
Planned enhancements included:
- Color-coded states showing coverage and availability at a glance.
- Clustered map pins to reduce visual noise in dense areas.
- Historical data views for patterns in carrier performance.
Together, these improvements would evolve the MVP into a dynamic, analytical platform that could support future visibility initiatives across Truckstop’s ecosystem.
