CASE STUDY
Overview
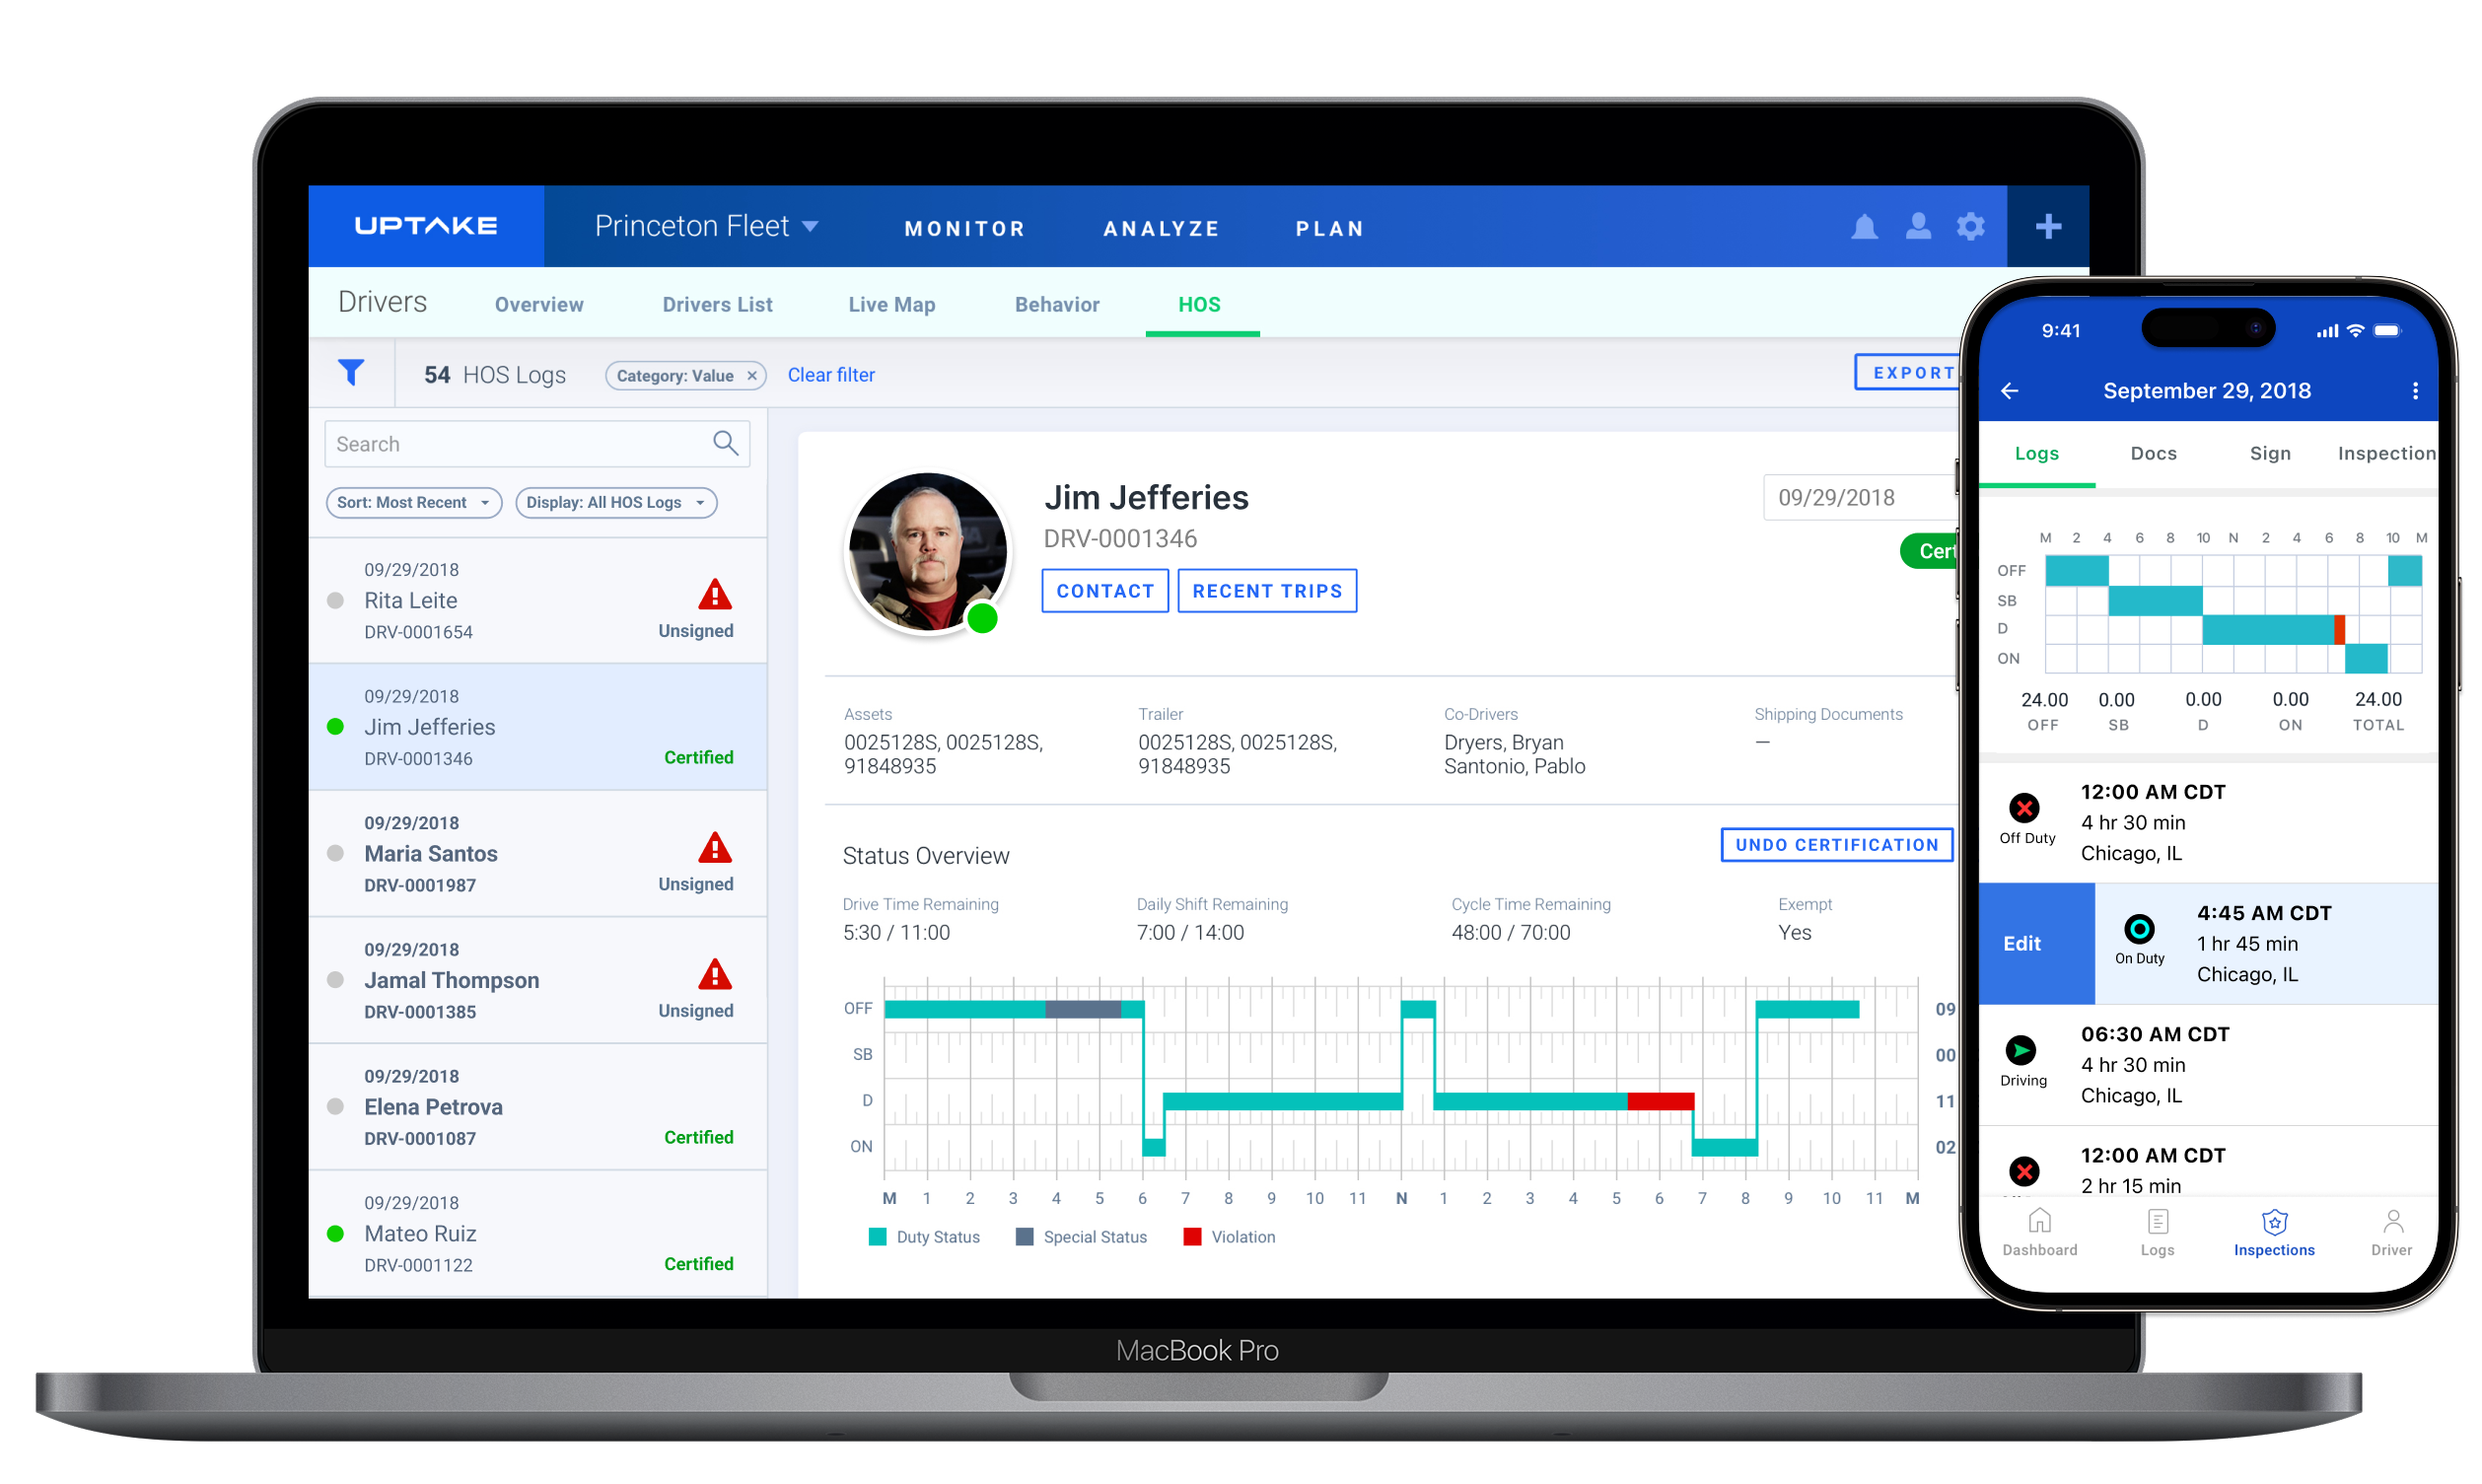
Uptake set out to simplify how fleets manage Hours of Service (HOS) compliance. Drivers and managers were spending too much time reconciling hours across different tools, which often led to errors and missed violations.
Because most carriers operate small fleets with ten or fewer vehicles, the design needed to be fast, simple, and require little training.
As the lead designer, I worked with a product manager, data scientists, and engineers to create a workflow that made log reviews clearer and more reliable. The project focused on the desktop HOS experience but also informed related map and mobile designs built on the same data system.
| Role | Lead UX/UI Designer |
| Industry | Logistics, Telematics, Fleet Management |
| Timeline | Q3–Q4 2018 |
| Tools | Figma, Sketch, InVision, Zeplin, Jira |
Making compliance manageable
DISCOVER
Problem
Before this project, fleet managers relied on spreadsheets, paper logs, and disconnected ELD tools to monitor driver hours. These manual methods made it difficult to confirm compliance, identify violations, or manage certifications efficiently.
Common issues included:
- Inconsistent visibility across drivers and fleets
- Manual and error-prone verification
- Confusing violation codes and terminology
These pain points showed how compliance management had become a time-consuming process that depended too much on interpretation rather than clear information.
Manual handwritten HOS tracking before digital integration.

The goal was to replace these fragmented tools with a unified, visual workflow that simplified how compliance teams reviewed and corrected logs.
Many competitive platforms (e.g. Motive, Samsara) emphasize proactive violation visibility and fast edits. Our approach aimed to match that clarity while layering behavior context.
Constraints shaped the framework for trust and consistency
DEFINE
Constraints
The Hours of Service (HOS) feature had to meet strict DOT and FMCSA requirements while fitting into Uptake’s existing logistics platform. Each update to a driver’s log had to remain traceable and auditable.
Technical constraints included data accuracy from multiple ELD providers, variation in log formats, and limited time for engineering support. The design needed to be simple to implement and consistent with other Uptake products.
Simplified data flow showing how HOS information entered the platform.

Goals
- Make it easy to identify violations and certification status at a glance
- Support safe, auditable log edits
- Reduce confusion through consistent labeling and visual hierarchy
- Create a foundation that could later expand into driver safety insights
To confirm accuracy and usability, I worked closely with compliance specialists and engineers to validate how log data should display, what edits were allowed, and how audit records would be preserved.
Initial layout exploration for log data and certification states.

Working within these limits meant finding a balance between accuracy, clarity, and speed. I started by mapping the old paper log format to a digital version that drivers would recognize. This became the basis for the first layout of the HOS feature.
Designing for clarity and compliance
DEVELOP
I created early wireframes that showed how driver logs, signatures, and violations could work together in one clear layout. The goal was to make the move from paper logs to digital feel familiar and easy to follow.
Early wireframe showing how the paper Hours of Service card was adapted into a digital layout

Once the layout felt right, I built the visual system that supported daily log reviews. Each card represented a driver’s log for one day, using color and icons to show if it was signed, unsigned, edited, or pending.
Log tile states designed for quick scanning across hundreds of driver logs.

I designed a system of log tiles that showed each driver’s daily record. Color and icons made it easy to tell if a log was signed, unsigned, edited, or pending review. This helped users move through large sets of data without opening each file individually.
Filter chips and expanded filters for isolating logs by violation status, signature, or edit state.

To make reviews faster, I added filters that let users isolate logs by violation type or signature status. These small controls gave managers more flexibility and reduced review time.
Detailed violation information surfaced directly in context, using color-coded states for clarity.

When users hovered or clicked on violation areas, a modal appeared with more details about the infraction. I introduced consistent color and labeling so violations were easy to spot and understand at a glance.
Editable segments maintain validation and audit integrity

I also designed the segment editor, a simple but essential form that let managers adjust driver logs while keeping them compliant with ELD rules. Since this was part of the MVP, the goal was to deliver a reliable baseline first and leave more advanced editing features for later phases.
As the core workflow came together, I expanded the design to show how log data connected to on-road behavior and location. This included mapping driver activity and visualizing speeding, idling, and braking events so managers could quickly spot trends and outliers.
Real-time driver map showing current locations, markers, and geofenced areas.

I designed the first version of the geofencing tools that let managers draw and monitor custom areas on the map. These were used to track driver movement around key locations such as customer sites, terminals, and delivery zones. My focus was on making the drawing tool precise, easy to adjust, and clear to read without crowding the map.
Geofencing design that allowed managers to draw, edit, and monitor custom regions directly on the map.

Trip Snapshot screens displayed events directly on route lines, making it easy to see where violations or safety risks occurred.
Snapshot design mapping overspeed and event patterns along multi-day trips.

I worked with data scientists and engineers to create a shared visual system for maps, markers, and color patterns that could scale across different fleet views.
To connect the driver’s experience with what managers saw, I also supported the design of the companion mobile app. It showed real-time drive time, alerts, and safety scores, giving drivers a clear picture of their performance and compliance status.
Driver companion app showing remaining drive time, alerts, and individual performance metrics.

Together, these tools helped turn Hours of Service into more than a compliance feature. They created a connected system that supported real-time visibility, safety awareness, and better coaching for drivers.
Outcomes and Results
DELIVER
The updated HOS experience gave managers faster, clearer visibility into driver activity and compliance status. The designs simplified daily reviews, reduced time spent searching for violations, and made audits more accurate.
Simplified dashboard view highlighting violation rate, audit completion time, and driver certification status.

While map and mobile concepts were explored alongside the HOS tools, the initial release focused on the core desktop experience. I worked with product and compliance teams to define success criteria for this MVP. Since full analytics weren’t available at the time, the results below reflect internal feedback and early performance expectations.
Easy Review
82%
Fleet managers said it was easier to review and sign logs.
Reduced Errors
68%
Teams reported fewer manual edits and clearer audit trails.
Faster Certification
78%
Managers completed certification checks more quickly after launch.
Better Visibility
74%
Users said it was easier to identify violations and missing logs.
These improvements built confidence in the system and established a foundation for future fleet-safety work at Uptake. The design principles from HOS were later reused in related tools for trip history, driver behavior, and predictive maintenance.

Reflections & Lessons Learned
The ELD compliance change came fast, and this project had to keep pace. While other products were competing directly with ELD providers, Uptake’s goal was to work alongside them and build a stronger foundation for fleet data.
The first step was to design a clear Hours of Service experience that could connect to the data coming from ELD systems. That structure later supported more advanced ideas, like fleet maintenance and driver scoring, which used data science to turn driver behavior into insights.
The work moved quickly, so the focus stayed on speed and clarity. Keeping the workflow simple made it possible to design and deliver fast without adding unnecessary features.
This project helped set the groundwork for future designs that brought together compliance, behavior, and data science within one connected system.