SHOWCASE
Overview
Market Conditions was designed to help carriers make better destination decisions before they searched for loads.
In a load board, the best load is not always the one that looks strongest upfront. Destination matters. A carrier may find a high-paying load, but still end up in a weak market with fewer options afterward.
The opportunity was to bring market context closer to the search decision, so users could understand regional strength, compare markets, and search with more intent.
| Role | Lead Product Designer |
| Company | Truckstop |
| Platform | Web / Load Board / Marketplace Tools |
| Focus | Search Behavior, market context, decision support |
1,200
Daily active users at launch
730
Sustained daily users
61%
Session-to-search conversion
“Destination” blind spots
Load data without market context
Carriers were making destination decisions inside the load board, but the load board was primarily built around available loads.
Users could compare origin, destination, rate, equipment, and timing. What was harder to understand was market position: whether a destination gave them strong options for the next move.
That meant a load could look good in the moment, while still leading the carrier into a weaker market afterward.

Signals outside the workflow
Market Conditions gave users a way to understand regional strength, but it lived outside the active search workflow.
The information was useful, but it was not naturally present when users were deciding where to search next.

Market-aware search
Shift the decision earlier
Instead of asking users to search first and react to a list of results, the experience helped them understand market conditions before choosing a destination.

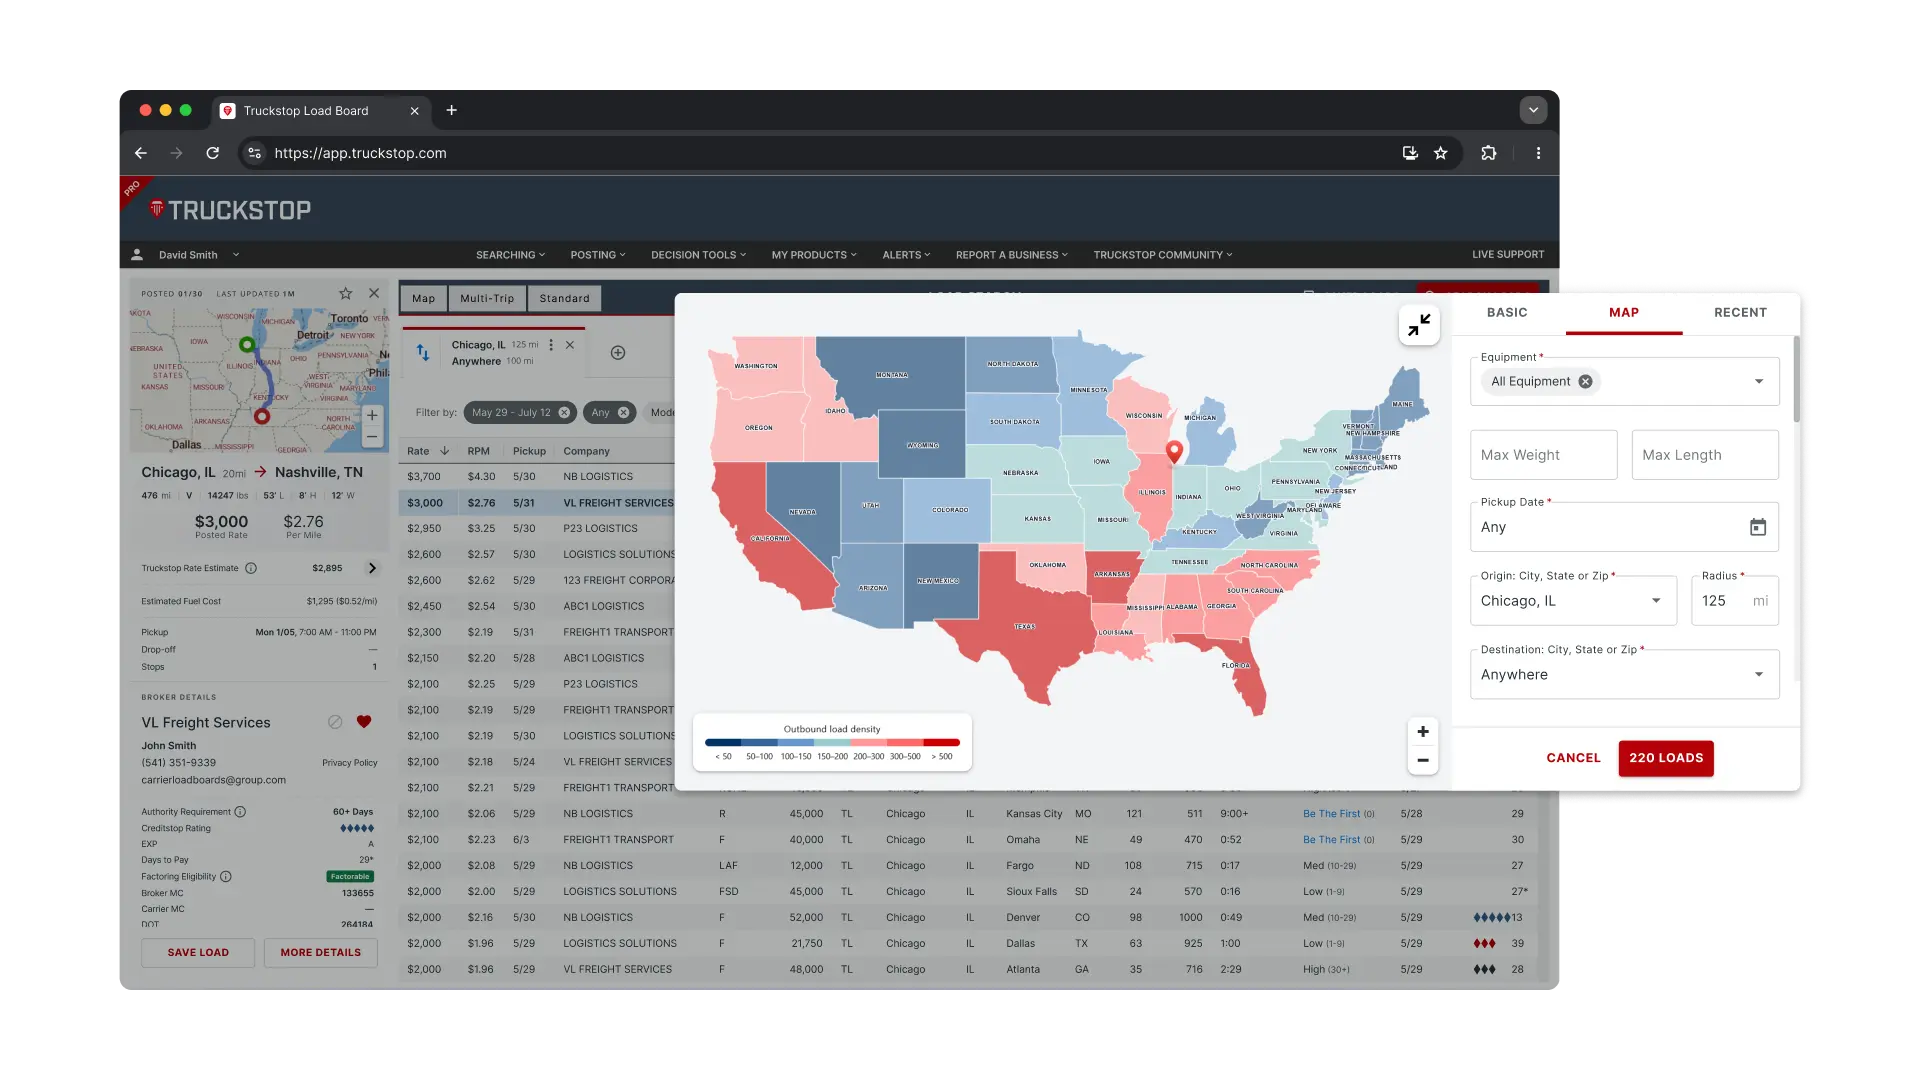
Map for scanning. Panel for understanding.
The core design decision was separating overview from detail.
The map helped users compare market strength quickly. The side panel explained what was happening in the selected market.
That structure kept the map readable, gave users a clearer way to inspect a region, and created room for deeper market signals over time.

Scan, select, inspect
The interaction model supported both quick comparison and deeper review.
Users could scan the map, select a region, and use the panel to understand the details behind that market. As the experience moved toward GA, we refined the visual system around readability: testing different color treatments, improving contrast, and making sure the map was easier to interpret across states and selected views.
Bringing market context into the workflow
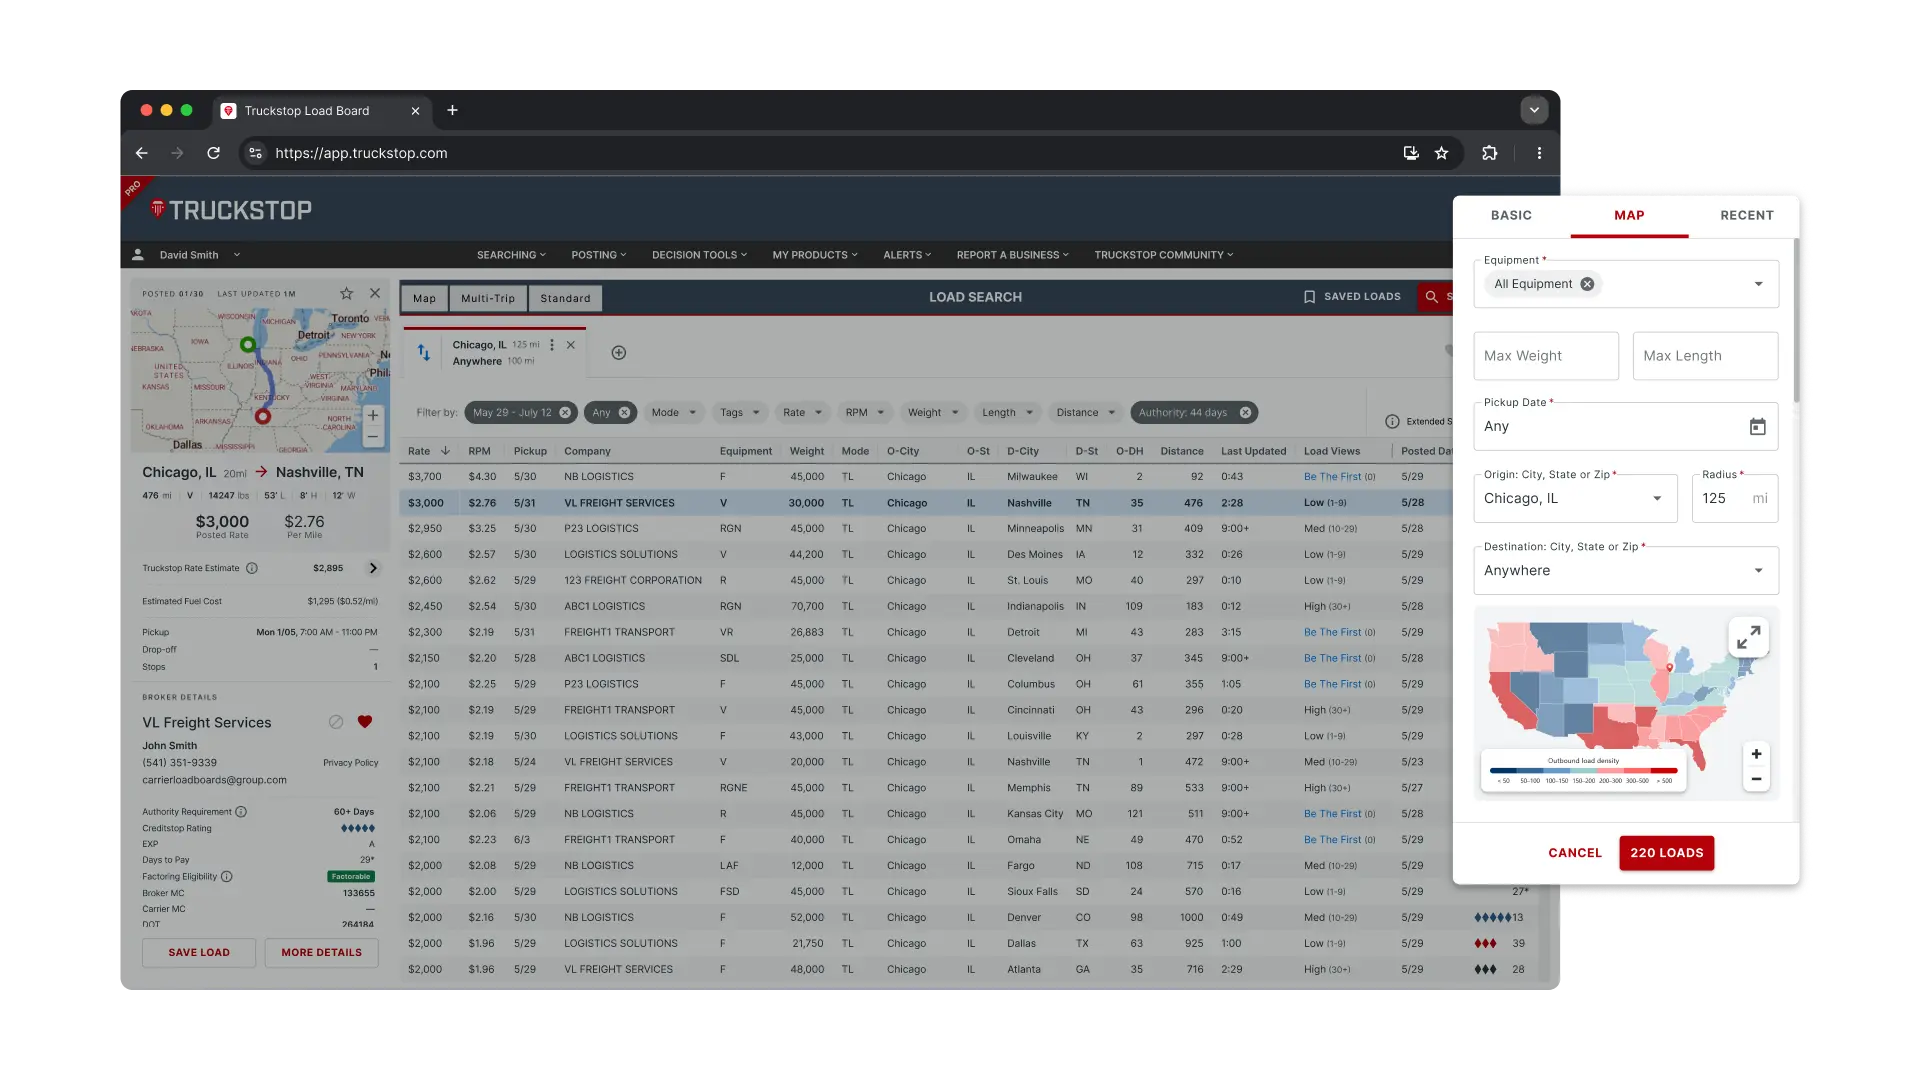
Search as the entry point
The standalone map helped make market strength easier to understand, but the bigger opportunity was placement.
If users had to leave search to understand the market, the information was useful but easy to miss.
So we brought a smaller version closer to the decision point by embedding Market Conditions into search as a Map tab. This let users check market strength while they were already thinking about destination, without disrupting the default load board workflow.
Outcome
Market Conditions launched to GA in October 2025 and established a measurable baseline for market-aware behavior in the load board.
1,200
Daily active users at launch
730
Sustained daily users
61%
Session-to-search conversion
It also created a foundation for future recommendation and decision-support work by bringing market context closer to the moment users decide where to search.